Plot an rpart object with all splits labeled with p-values and all nodes labeled with confidence intervals.
Source:R/plotting_functions.R
treeval.plot.RdEssentially a wrapper function for rpart.plot() from the rpart.plot package, but
additional arguments allow user to add p-values and confidence intervals to plots.
treeval.plot(
  tree,
  sigma_y = NULL,
  nn = TRUE,
  printn = TRUE,
  inferenceType = 2,
  digits = 3,
  alpha = 0.05,
  permute = FALSE,
  ...
)
Arguments
| tree | An rpart tree. The tree must have been build with parameter |
|---|---|
| sigma_y | Provide the standard deviation of y, if known. If not provided, the sample standard deviation of y will be used as a conservative estimate. |
| nn | boolean- would you like node numbers to be printed? Nodes are numbered using the same methodology as the |
| printn | boolean - would you like the number of observations to be printed in each node? |
| inferenceType | An integer specifying which pieces of inference information should be added to the plot. The options
currently available are
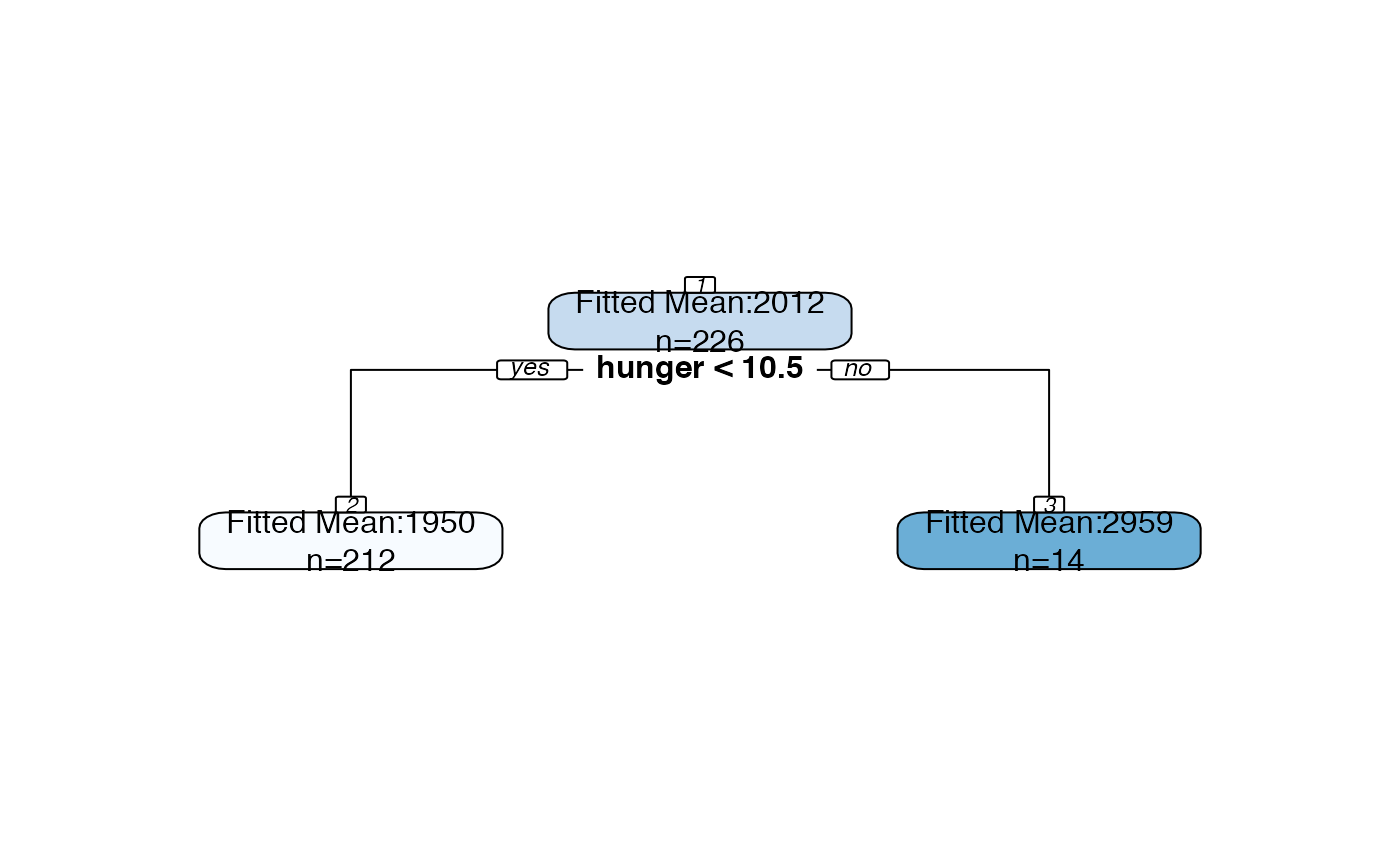
(0) No confidence intervals, p-values, or "fitted mean" label. Just calls |
| digits | Integer- how many digits would you like the text in the plot rounded to. |
| alpha | If inferenceType is such that confidence intervals will be printed, |
| permute | If inferenceType is such that confidence intervals will be printed, should the conditioning set for the confidence intervals include all permutations of the relevant branch? Setting this to TRUE will lead to slightly narrower confidence intervals, but will make computations more expensive. See paper for more details. |
| ... | Additional arguments are passed on to rpart.plot(). Examples include |
Examples
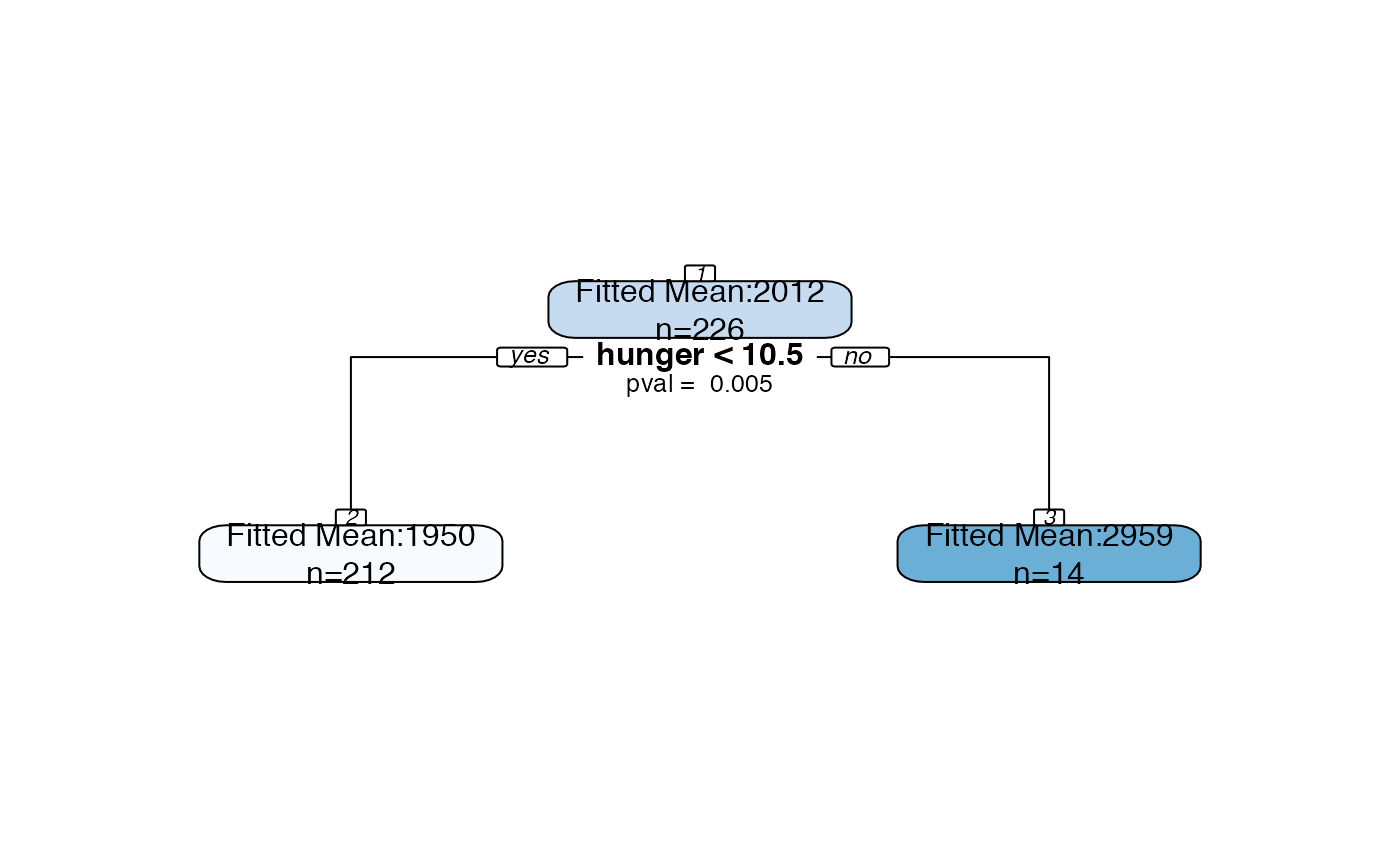
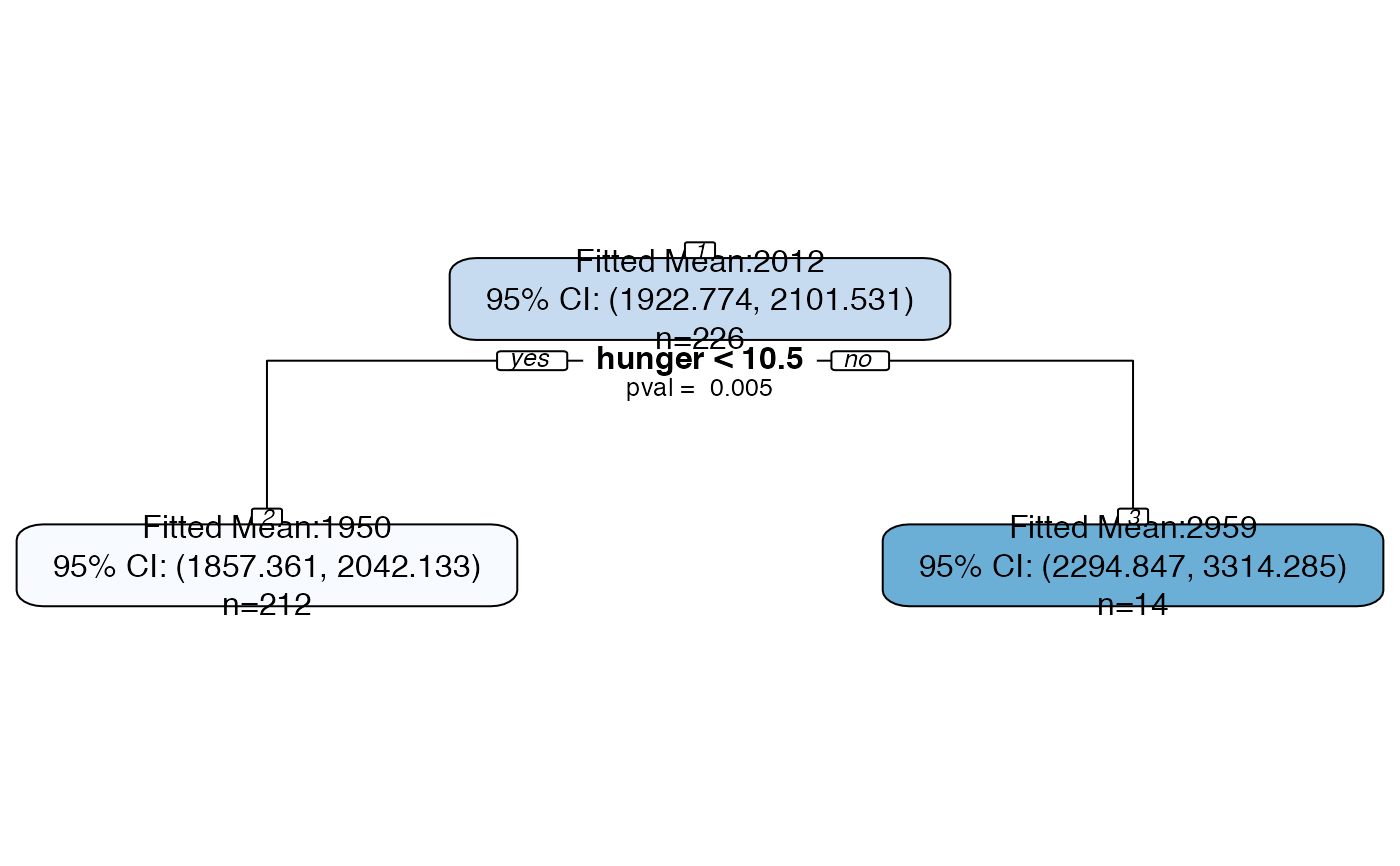
bls.tree <-rpart::rpart(kcal24h0~hunger+disinhibition+resteating, model = TRUE, data = blsdata, maxdepth=1) treeval.plot(bls.tree, inferenceType=0)treeval.plot(bls.tree, inferenceType=1)treeval.plot(bls.tree, inferenceType=2)