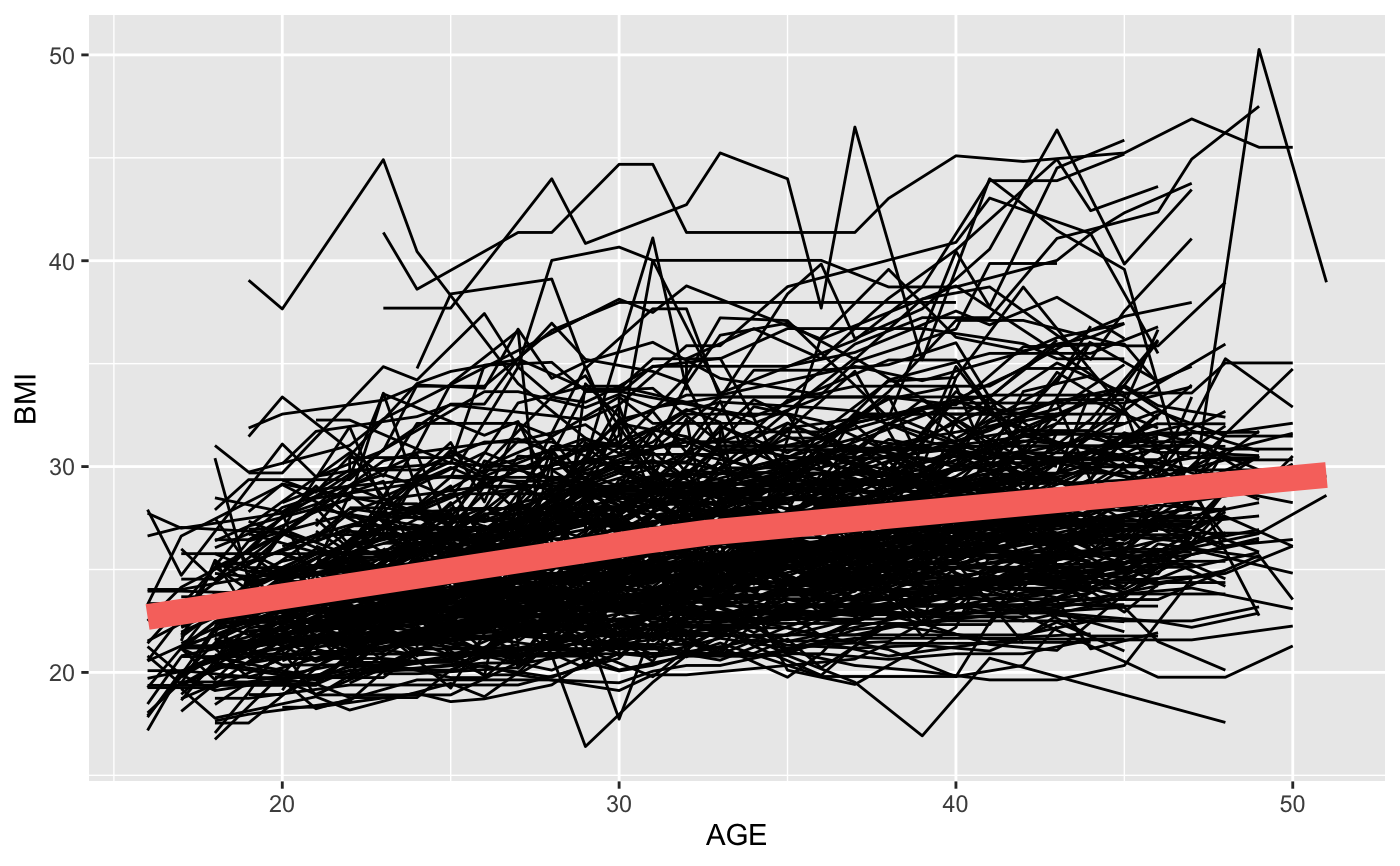
Creates a simple plot of the predicted trajectory at a given node. Option to include the data that falls in the node on the same plot.
plotNode(tree, node, includeData = FALSE, estimateIntercept = TRUE)
Arguments
| tree | A model returned from splineTree() |
|---|---|
| node | A node number. Must be a valid terminal node for the given spline tree. To view valid terminal node numbers, use stPrint() or treeSummary(). |
| includeData | Would you like to see the data from the node plotted along with the predicted trajectory? |
| estimateIntercept | If the tree was built without an intercept, should the average starting response of all the individuals in the node be added to the trajectory to give the plot interpretable values? Or should the shape of the trajectory be plotted without any regard to the intercept? |
Examples
split_formula <- ~HISP + WHITE + BLACK + SEX + Num_sibs + HGC_FATHER + HGC_MOTHER
tree <- splineTree(split_formula, BMI~AGE, idvar = "ID",
   data = nlsySample, degree = 1, df = 3,
   intercept = TRUE, cp = 0.005)plotNode(tree, 6, includeData=TRUE)