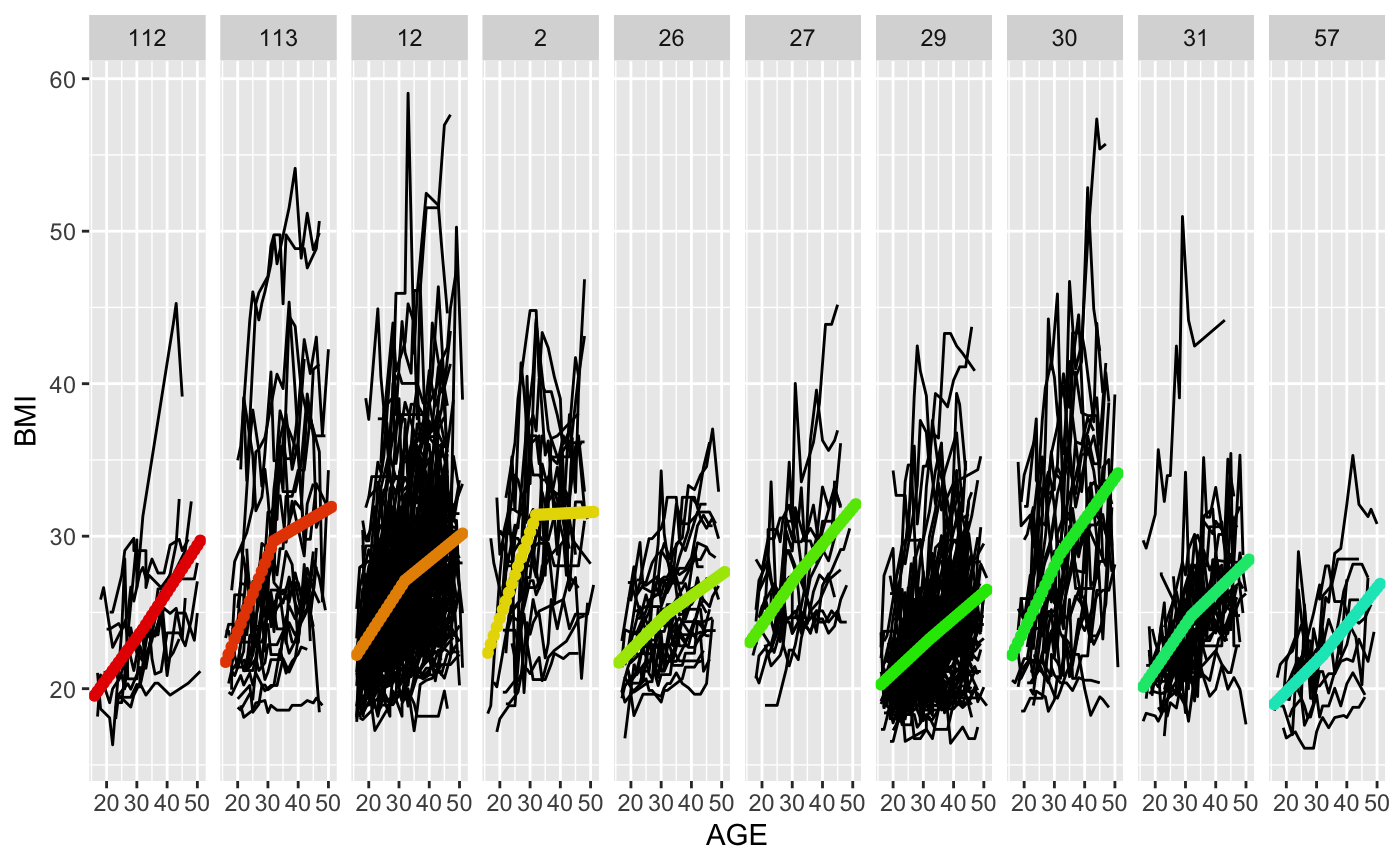
Uses ggplot to create a paneled spaghetti plot of the data, where each panel corresponds to a terminal node in the tree. Allows users to visualize homogeneity of trajectories within the terminal nodes of the tree while also looking at the trajectories of different nodes side by side.
spaghettiPlot(model, colors = NULL)
Arguments
| model | a model returned from splineTree() |
|---|---|
| colors | optional argument specifying colors to be used for each panel. |
Examples
nlsySubset <- nlsySample[nlsySample$ID %in% sample(unique(nlsySample$ID), 400),]
split_formula <- ~HISP + WHITE + BLACK + SEX + Num_sibs + HGC_FATHER + HGC_MOTHER
tree <- splineTree(split_formula, BMI~AGE, idvar = "ID",
   data = nlsySubset, degree = 1, df = 3,
   intercept = TRUE, cp = 0.005)spaghettiPlot(tree)