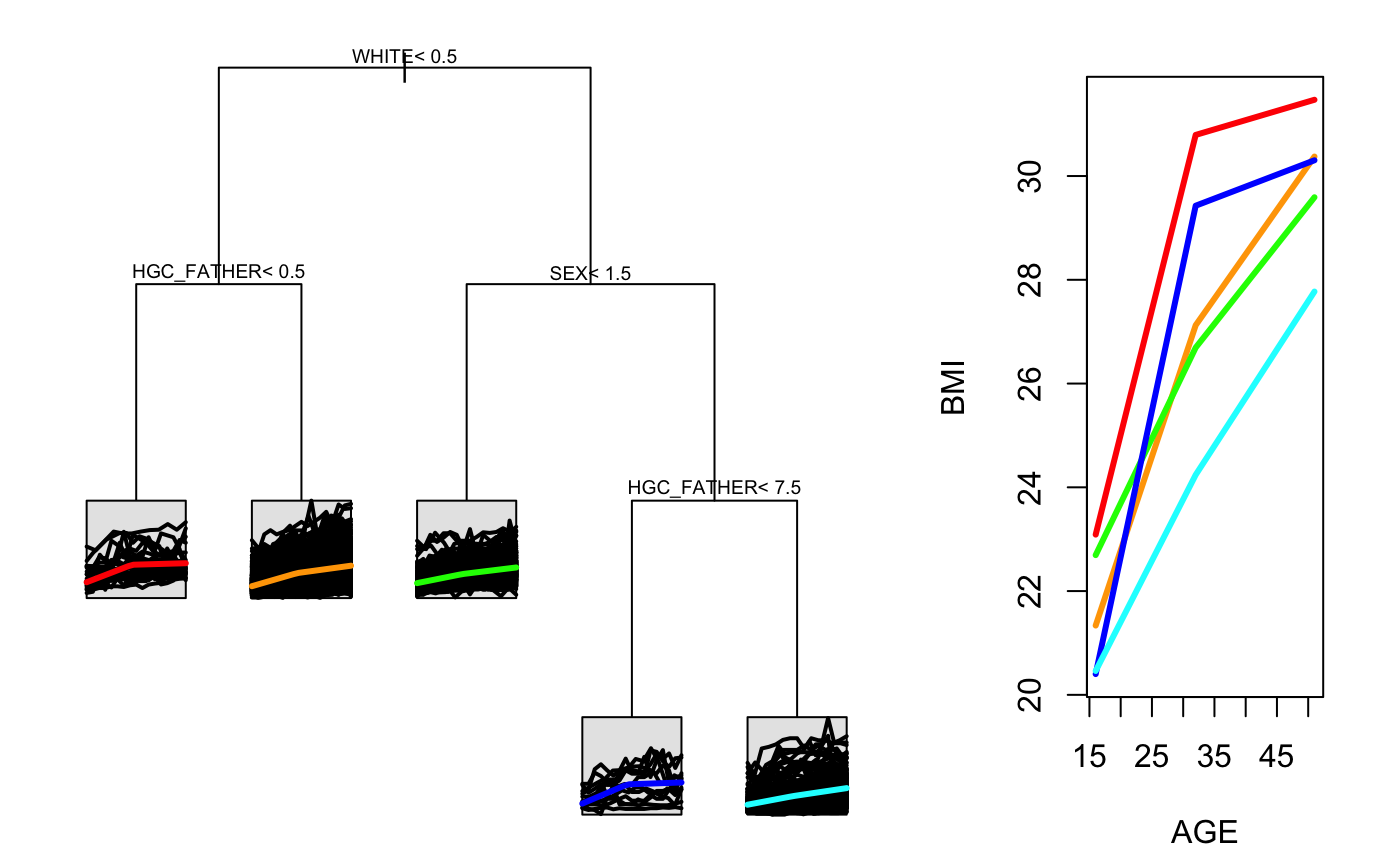
Creates a two paneled plot of a splinetree that shows both the tree and the trajectories side by side. Note that this function has trouble when the plot window is not wide enough. If nothing shows up in RStudio, try increasing the size of the plot window and trying again. For a tree without an intercept, intercepts are estimated after-the-fact for each node using the average starting value in the data so that the plotted trajectories have reasonable response values.
stPlot(model, colors = NULL)
Arguments
| model | A model returned from splineTree() |
|---|---|
| colors | A list of colors that will be used for the trajectories (if NULL, will automatically select colors from rainbow color scheme. |
Examples
split_formula <- ~HISP + WHITE + BLACK + SEX + Num_sibs + HGC_FATHER + HGC_MOTHER tree <- splineTree(split_formula, BMI~AGE, idvar = "ID", data = nlsySample, degree = 1, df = 3, intercept = TRUE, cp = 0.005)